CDE is one of the plugins to the Pentaho BI Server, contributed and maintained by Pentaho Partner webdetails.
We create dashboards using this tool.
Community Dashboard Editor (CDE) was born to simplify the creation, edition and rendering processes of the CTools Dashboards.
CDE is a very powerful and complete tool, combining front end with data sources and custom components in a seamless way.
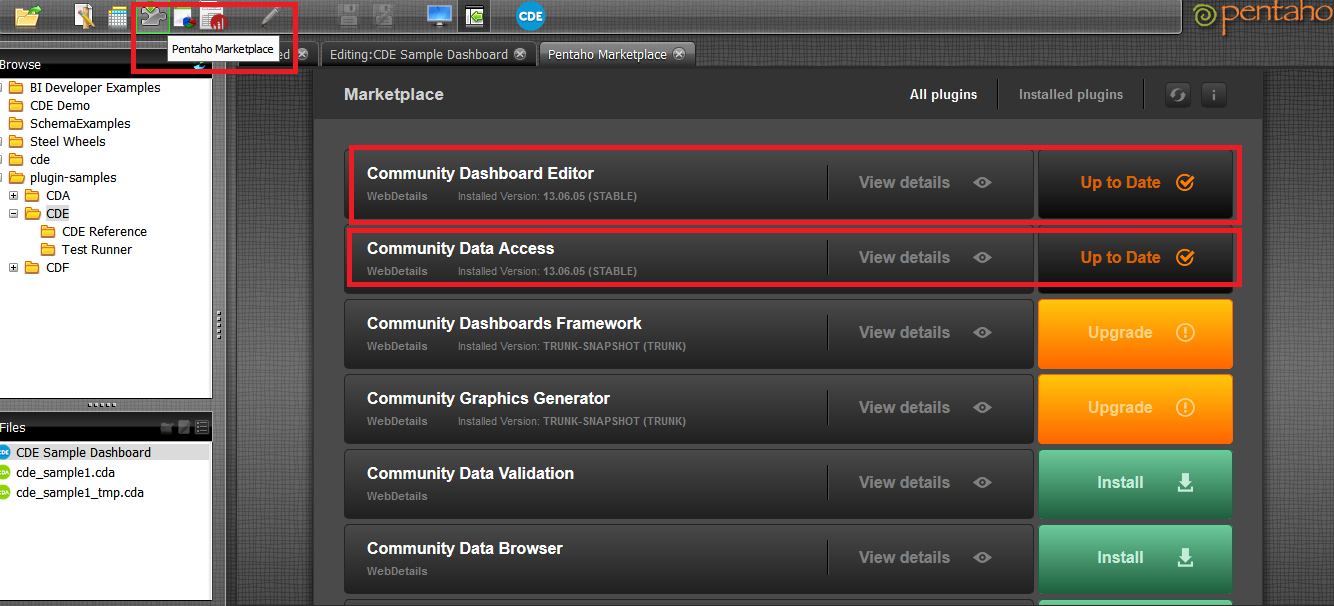
You can find the symbol “Pentaho Market place” on the menu bar..
Click on it you can see the Pentaho Marketplace editor as shown in below figure.
Find Community Dashboard Editor and Click on install.
As I have already installed it is showing up Up to Date.
These all plug-ins are updatable so every time it’s better you need to upgrade.
You must install the dependencies plug-ins before you start working with CDE.
 The dependencies for CDE are:
CDF(Community Dashboard Framework)
CDA(Community Data Access)
You must restart your server to take the effect of installation.
Where you can find the sample examples after installing?
* In the left side panel you can find plugin-samples folder.
* Expand it and then click on CDE
* In the Files you can find sample example CDE Sample Dashboard.
* Right Click on CDE_Sample Dashboard àThen click on Edit.
CDE has 3 major components
They are.
* Layout
* Componets
* Data Sources.
CDE has developed based on MVC-2 architecture of Advanced Java Technologies.
* Layout - View
* Components – Controller
* Data sources – Model.
Find the images below to understanding the basic of CDE.
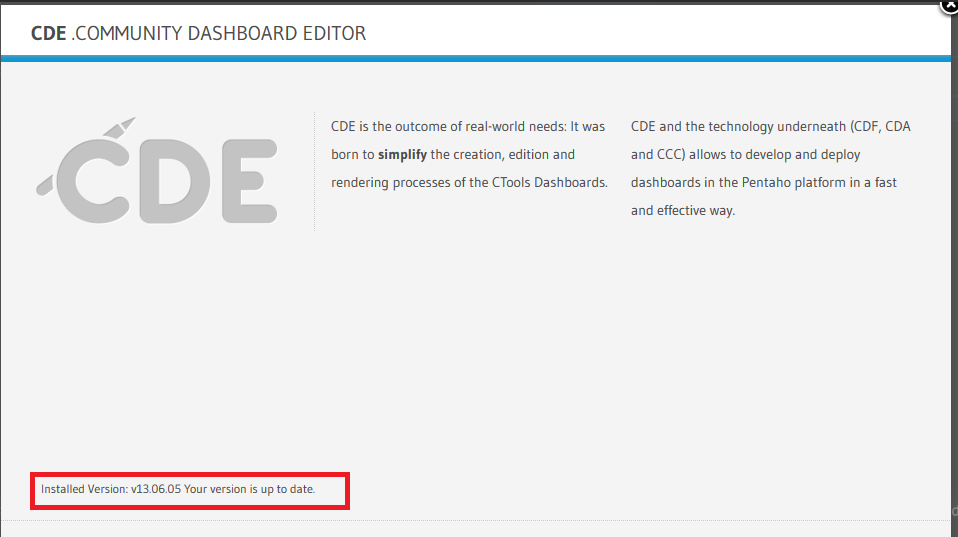
* Scroll down the dashboard. Find “About” on the left side and find the version number of CDE installed.
* Close the version window and Just click on Preview. I’ll let you know how to work out with all the components in CDE with a good working example.
* Now, just click on Preview. You can find the output of the dashboard as shown in below figures.
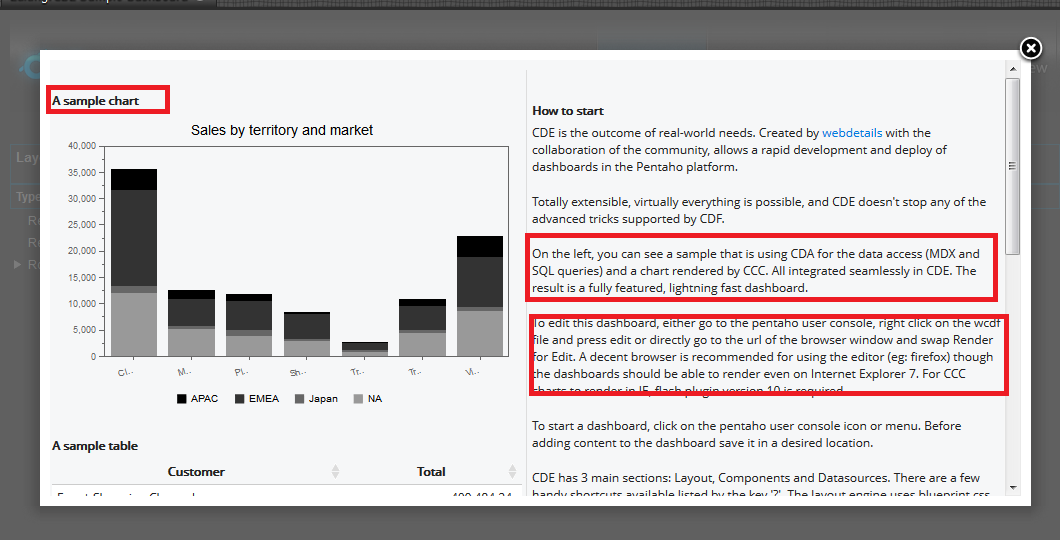
* Scroll down.
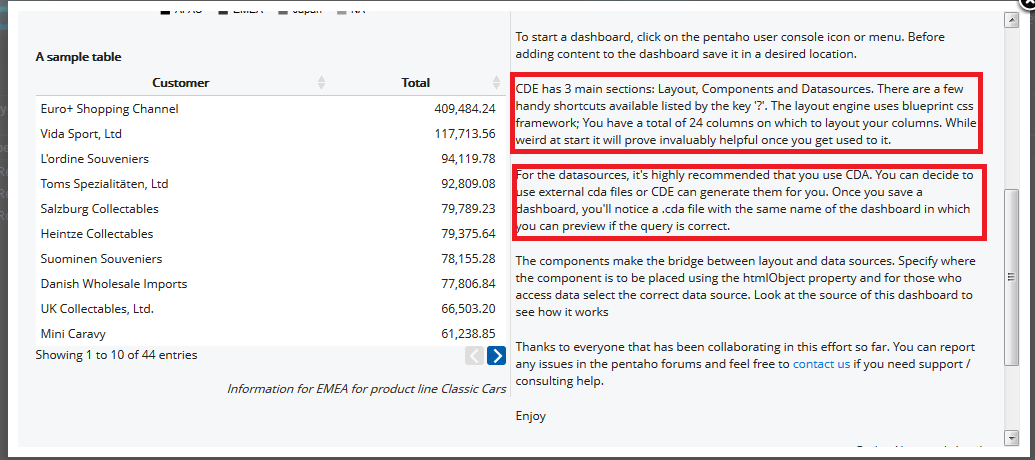
* Read the points that were in boxes. You will get the basic idea of CDE dash boarding.
Example:
Aim : To design a simple chart(on dashboard)
Environment:
* Pentaho BI Server community 4.8 stable version.
* CDA,CDF & CDE installed in the server from Market place.
Database: SampleData (It comes along with pentaho installation.. for this artical I'm not connecting to any external database. In the upcoming artical you can find working with databases)
* This example was based upon CCC-Version1. The current Example which I’m going to explain is based upon CCC2-Version2.
* There is a lots of changes made from CCC-V1 to CCC-V2.
* Make sure your environment of CDE supports CCC-V2 for the example.
Step 1: Creating New CDE Dashboard
There are two ways to create a new CDE dashboard.
i) From the menu bar
ii) By clicking CDE icon as shown in figure
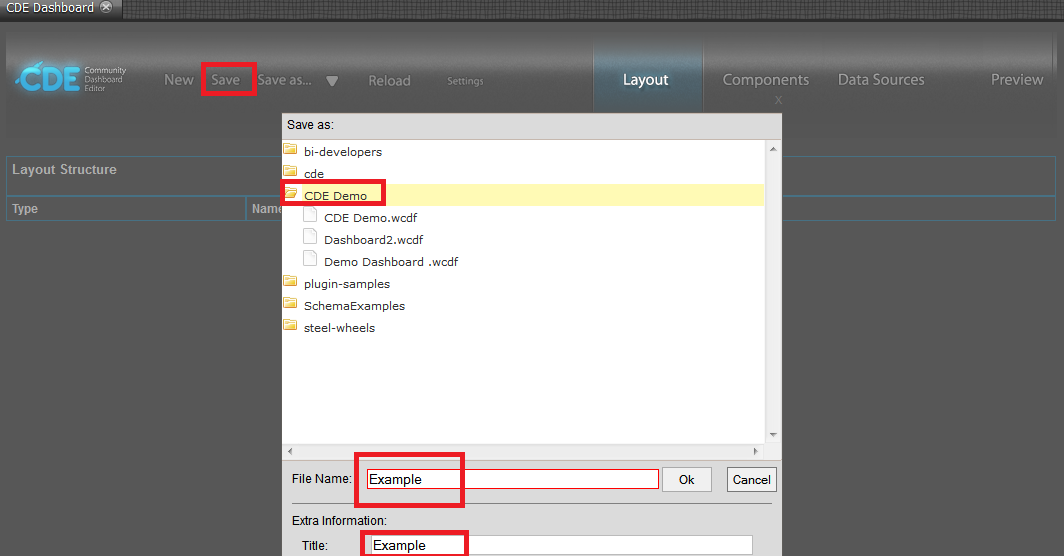
Save your dashboard
Click on Save -> Save your dashboard in your
fav folder with your fav name.
After saving your dashboard “Refresh your Repository” and then you can
find the file as shown below figure.
Step 2: Working with Layout, Componets and Data
sources.
CDE is mainly works on scripting such as css, javascript.
Click on + sign as shown in below figure. (We are
going to add Cascading Style Sheet code(css) code to our dashboard).
Resource type : css
External file
Resource file : click on ^ that
is highlighted using arrow in the below image.
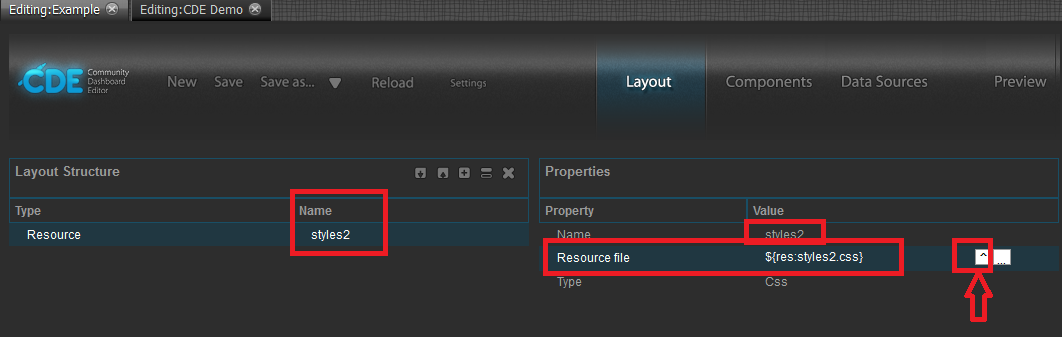
· * Give Styles2(do not give Styles2.css i.e, only
give name but not extension).
· * It automatically cmes with .css extension and
with $ and flower braces.
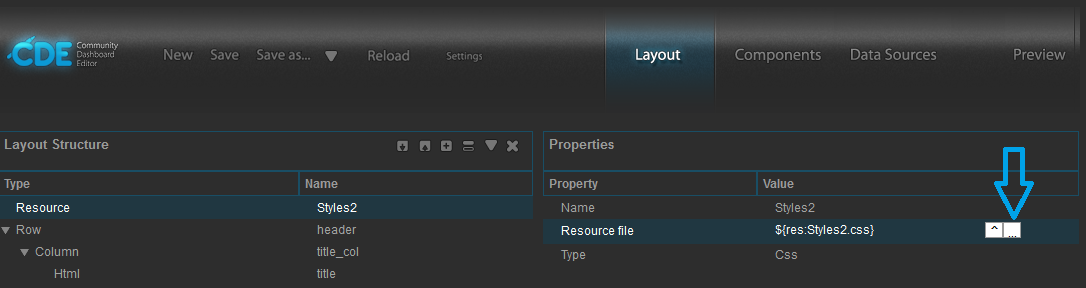
· * Save the css file externally to a folder as
shown in below figure.
· * To see the Styles2.css appearing in the folder
your file must contain some css code.
· * You must refresh your Repository to see the name
of the file(Styles2.css) in the folder.
Giving Title
to Dashboard:
·
CDE layout mainly works on Rows and Columns.
·
Click on Add row symbol as shown in below figure.
·
Give name of the Row and give back ground colour
as shown in below figure.
·
And give Corners: Round( it is below the back
ground , not shown in the image-it is not visible here in the image)
·
Now add Column(find ||) symbol on Layout
Structure and click on it.
·
Give all the necessary properties as shown in
the below figure.
·
Name: title
·
HTML : <h1> Sales OverView YDT <h1>
( as show in figure at arrow symbol click on button.. You will be prompted to a
new window there you have to write this HTML Code)
·
Font Size: 10
v See the preview:
The preview consists of only the title of the dashboard with
its layout.
It is further going to be modified.
·*
Add your .css code here...
Css code
Body{
background-color:#fffdf1;
}
h1{
font-size:24px;
color:#fff;
margin-left:10px;
margin-top:10px;
}
|
Now see the preview.
By the time you get some idea on it.
Do as follows, I’m reducing the images now as you might get
some idea..
Add another row -> Column->Html as shown in figure.
For html give Name as
title and write HTML code <h3>Sales
Performance</h3> in HTML
editor
Add the following code to Styles.css to editor
h3{
font-size:18px;
font-weight:bold;
color:#b68c58;
margin-left:10px;
margin-top:10px;
margin-bottom:8px;
}
.salesTitle{
color:#666;
height:2px;
margin-top:10px;
margin-left:10px;
margin-bottom:2px;
width:939px;
}
|
Find the images for doing the above and see the preview
again
Add another column as shown in below figure
Give the following properties:
Name: sales_chart
Span size: 16
Now working with Data
Sources and Query part:
·
Click on Data Sources
·
Find SQL Queries in Left panel.
·
Click on sql over sqlJndi
·
In left panel give Properties
o
Name :
get_sales_performance
o
Access
Level : public (default)
o
Jndi:
SampleData(We are working with pre defined database that comes along with
pentaho software to develop this dashboard)
o
Query:
(
SELECT
'Profit' as CATEGORY,
'Measure' as SERIES,
SUM(ORDERFACT.TOTALPRICE-ORDERFACT.QUANTITYORDERED*PRODUCTS.BUYPRICE)
AS MEASURE
FROM
ORDERFACT
INNER JOIN PRODUCTS ON PRODUCTS.PRODUCTCODE = ORDERFACT.PRODUCTCODE
WHERE
YEAR_ID = 2004
)
UNION ALL
(
SELECT
'Profit' as CATEGORY,
'Target' as SERIES,
SUM(ORDERFACT.TOTALPRICE-ORDERFACT.QUANTITYORDERED*PRODUCTS.BUYPRICE)
AS MEASURE
FROM
ORDERFACT
INNER JOIN PRODUCTS ON PRODUCTS.PRODUCTCODE = ORDERFACT.PRODUCTCODE
WHERE
YEAR_ID = 2003
)
UNION ALL
(
SELECT
'Cost' as CATEGORY,
'Measure' as SERIES,
SUM(ORDERFACT.QUANTITYORDERED*PRODUCTS.BUYPRICE)
AS MEASURE
FROM
ORDERFACT
INNER JOIN PRODUCTS ON PRODUCTS.PRODUCTCODE = ORDERFACT.PRODUCTCODE
WHERE
YEAR_ID = 2004
)
UNION ALL
(
SELECT
'Cost' as CATEGORY,
'Target' as SERIES,
SUM(ORDERFACT.QUANTITYORDERED*PRODUCTS.BUYPRICE)
AS MEASURE
FROM
ORDERFACT
INNER JOIN PRODUCTS ON PRODUCTS.PRODUCTCODE = ORDERFACT.PRODUCTCODE
WHERE
YEAR_ID = 2003
)
UNION ALL
(
SELECT
'Revenue' as CATEGORY,
'Measure' as SERIES,
SUM(ORDERFACT.TOTALPRICE)
AS MEASURE
FROM
ORDERFACT
WHERE
YEAR_ID = 2004
)
UNION ALL
(
SELECT
'Revenue' as CATEGORY,
'Target' as SERIES,
SUM(ORDERFACT.TOTALPRICE)
AS MEASURE
FROM
ORDERFACT
WHERE
YEAR_ID = 2003
)
|
Working with Component
·
Click on Components
·
On the left panel click on Charts
·
In properties give the following
o
Name: sales_chart
o
Datasource: get_sales_performance
o
Width: 610
o
Height:140
o
HtmlObject : sales_chart
o
SeriesInRows : False
·
I will show you how to work with Advanced
Properties in the upcoming posts on CDE.
Now save your dashboard and Preview
The preview will look like as follows
That’s it we are done with the Dashboard.
Thank you for reading this post :)