Pentaho Tools :

Pentaho C-Tools(CDE,CDF,CDA),Pentaho CE & EE Server,OLAP-Cubes,Analysis using Pivot4J, Saiku Analytics, Saiku Reporting, Ad-hoc Reporting using Interactive Reporting Tool,Dashboards,Reports using PRD, PDD,Data Integration using Kettle ETL,Data Mining usign WEKA,Integration of Servers with Databases,Mobile/iPad compatible Dashboards using Bootstrap Css,Drilldown dashboards,Interactive Dashboards

Tuesday, 10 May 2016

D3 Chord diagram Visualization example in Pentaho CDE

Hi,
In this post you will learn how to develop D3 Chord diagram.

Software used for this example : 
1) Pentaho BA Server 6.1 CE
2) Postgre SQL foodmart database
3) Pentaho Ctools 6.1.0.1-196 (master)
4) D3 Component Library 14.06.18

NOTE: Original Code is taken from this site with slight java script modifications 
https://bl.ocks.org/mbostock/4062006

(Click on image to get best view)

 Steps : 
1) Install D3 Components Library from Market Place
2) After successful installation, restart the server if it is already running. 
3) From the home menu click on "Create New" -> "CDE Dashboard"

4) Layout section :
#) Design the layout as shown in above image
2 rows, first row is for dashboard title, 2nd row is for dashboard content(table & chord diagram). 
Adjust the layout if you have any parameters to display 
(This dashboard is not associated with any parameters). 

5) Data sources section :
Connect to postgre SQL database as shown in below image and test the connection using CDA editor and preview the query written. 

( Click on image to get best view)
6) Components section :
#) From D3 Components section select "D3 Component" as shown in below image
#) Fill the Component properties as shown in below image

(Click on image to get best view)

#) Core part : Convert SQL result set to matrix format and write D3 script for chord diagram
Copy paste below code in "Custom Chart Script" code section (later modify it as per your requirement)


function f(dataset){

var matrix = [];

for(var i=0; i < dataset.resultset.length; i++){
    var dataObject=[];
    /*
    dataObject.a = dataset.resultset[i][0];
    dataObject.b = dataset.resultset[i][1];
   alert(dataObject.a);
   matrix.push(dataObject);
   */
   matrix.push([dataset.resultset[i][0],dataset.resultset[i][1],dataset.resultset[i][2],dataset.resultset[i][3]]);

    alert([dataset.resultset[i][0]]);
   alert([dataset.resultset[i][1]]);
   alert([dataset.resultset[i][2]]);
   alert([dataset.resultset[i][3]]);
    }
  

/*   
var matrix = [
  [11975,  5871, 8916, 2868],
  [ 1951, 10048, 2060, 6171],
  [ 8010, 16145, 8090, 8045],
  [ 1013,   990,  940, 6907]
];
*/

var chord = d3.layout.chord()
    .padding(.05)
    .sortSubgroups(d3.descending)
    .matrix(matrix);

var width = 860,
    height = 400,
    innerRadius = Math.min(width, height) * .41,
    outerRadius = innerRadius * 1.1;

var fill = d3.scale.ordinal()
    .domain(d3.range(4))
    .range(["#000000", "#FFDD89", "#957244", "#F26223"]);

var svg = d3.select("#"+this.htmlObject).append("svg")
    .attr("width", width)
    .attr("height", height)
  .append("g")
    .attr("transform", "translate(" + width / 2 + "," + height / 2 + ")");

svg.append("g").selectAll("path")
    .data(chord.groups)
  .enter().append("path")
    .style("fill", function(d) { return fill(d.index); })
    .style("stroke", function(d) { return fill(d.index); })
    .attr("d", d3.svg.arc().innerRadius(innerRadius).outerRadius(outerRadius))
    .on("mouseover", fade(.1))
    .on("mouseout", fade(1));

var ticks = svg.append("g").selectAll("g")
    .data(chord.groups)
  .enter().append("g").selectAll("g")
    .data(groupTicks)
  .enter().append("g")
    .attr("transform", function(d) {
      return "rotate(" + (d.angle * 180 / Math.PI - 90) + ")"
          + "translate(" + outerRadius + ",0)";
    });

ticks.append("line")
    .attr("x1", 1)
    .attr("y1", 0)
    .attr("x2", 5)
    .attr("y2", 0)
    .style("stroke", "#000");

ticks.append("text")
    .attr("x", 8)
    .attr("dy", ".35em")
    .attr("transform", function(d) { return d.angle > Math.PI ? "rotate(180)translate(-16)" : null; })
    .style("text-anchor", function(d) { return d.angle > Math.PI ? "end" : null; })
    .text(function(d) { return d.label; });

svg.append("g")
    .attr("class", "chord")
  .selectAll("path")
    .data(chord.chords)
  .enter().append("path")
    .attr("d", d3.svg.chord().radius(innerRadius))
    .style("fill", function(d) { return fill(d.target.index); })
    .style("opacity", 1);

// Returns an array of tick angles and labels, given a group.
function groupTicks(d) {
  var k = (d.endAngle - d.startAngle) / d.value;
  return d3.range(0, d.value, 1000).map(function(v, i) {
    return {
      angle: v * k + d.startAngle,
      label: i % 5 ? null : v / 1000 + "k"
    };
  });
}

// Returns an event handler for fading a given chord group.
function fade(opacity) {
  return function(g, i) {
    svg.selectAll(".chord path")
        .filter(function(d) { return d.source.index != i && d.target.index != i; })
      .transition()
        .style("opacity", opacity);
  };
}


}

#) Now, save your dashboard and preview it.

#) CSS used for this dashboard in "Resources" section is

body{
    margin-top:30px;
    font: 10px sans-serif;
}

#row2Col1Table_wrapper{
          padding-top: 50px;
}
.chord path {
    fill-opacity: .67;
    stroke: #000;
    stroke-width: .5px;
}

.label{
    font : 10px sans-serif;
}  


I hope this post helps some one in the community to get start with Custom D3 charts. 

In future posts you may find interesting visualizations in this site. Stay tune for updates. 


Download this example :
Click Me

Deployment Procedure:
Upload this example using PUC and in the data sources change the postgresql url and passwords as per your requirement.


 References for this post : 

1) http://diethardsteiner.github.io/dashboards/2014/10/15/CCC-Add-Event-Info-to-your-Charts.html 
2) https://bl.ocks.org/mbostock/4062006 
3) http://bl.ocks.org/mbostock/1046712 
4) http://www.delimited.io/blog/2013/12/8/chord-diagrams-in-d3

- Sadakar Pochampalli  

Sunday, 8 May 2016

Oacle 11g express edition database connection and sample query execution example in Pentaho CDE

Hi,
In this post you will see how to connect to Oracle 11g Express edition and how fire a query against the connected data-source in Pentaho CDE

Software used to test this example : 
1) Pentaho BA Server 6.1
2) Pentaho Ctools (6.1- CDE,CDF,CDA,CGG)


Steps : 
1) Download and install "ojdbc6" in "lib" folder of pentaho installatio.
 http://www.oracle.com/technetwork/apps-tech/jdbc-112010-090769.html
 Driver installation location : 
(E:\2_Archive_Installed\Pentaho\6.1\biserver-ce-6.1.0.1-196\biserver-ce\tomcat\lib)

2) Start the pentaho BA server using "start-pentaho.bat" . (Double click on it)

3) Create a new dashboard (Home -> Create New -> Dashboard) and save the dashboard with the name of your choice ( In my case it is "Oracle 11g Connection")

4) Design the layout for a table component ( row -> Column).

5) Navigate to Data source section and click on " SQL Queries" from the bottom and then click on "sql over sqljdbc"
6) In its properties, fill the query name, username, password, URL as shown in below image.
Name= Oracle11g_Query
Driver = oracle.jdbc.OracleDriver
User Name = sadakar
Password = sadakar
URL =  jdbc:oracle:thin:@//localhost:1521/XE ( I used default SID as it is my local instance) 
Query = SELECT * FROM employee

 
7) Test whether the connection is successful or not and preview the query output.

#) Save the dashboard, unless you save it, the CDF will not generate .cda file to test the connection
    (Of course, you can write your own CDA file, but in this test I am not going to talk about it).
#) Go the location where the .cda generated (its the location where you saved your dashboard).
#) Open the CDA file in Edit mode and click on "Preview" button.

#) It will open a new tab in the browser

Sample link for CDA 
(http://localhost:9090/pentaho/plugin/cda/api/previewQuery?path=/public/D3%20Calendar%20View%20Example/Oracle%2011g%20Connection.cda)

#) Select the "Data Access ID" and see the result set. If you wont see the preview you must check the  database connection properties. (You can use any other client tool that takes SQL url, username, password and driver class name).


8) Now, take a component and populate this result set ( In my case, I took "Table" component from Components section tested it).
Sample output of table component on dashboard: 

This way one can connect to "Oracle 11g Express edition". I hope it helps someone in the community.

References : 
URL I have taken from : https://razorsql.com/docs/help_oracle.html
Driver class & Other formats of URL : https://docs.oracle.com/cd/E11882_01/appdev.112/e13995/oracle/jdbc/OracleDriver.html

- Sadakar Pochampalli  
 

Stream lookup Step sample example using oracle tables in PDI

Hi,

This is re-blogging from below my previous post :
http://pentaho-bi-suite.blogspot.in/2014/09/stream-lookup-step-explained-with.html

Just thought of doing the same example using Oracle 11g Express database and here are the steps how I did.
You will learn , how to connect to Oracle 11g database and Stream lookup step capability with tables. 

Software Used for this example :  
1) Oracle 11g Express Edition
2) Pentaho Data Integration 6.1 CE

First, we will see how to connect to Oracle 11g Express edition in Pentaho data integration. 

NOTE : 
Before connecting oracle xe database(or database of your choice) download ojdbc6 driver from http://www.oracle.com/technetwork/apps-tech/jdbc-112010-090769.html site and paste in "lib" folder that can found at kettle installation folder at E:\2_Archive_Installed\Pentaho\6.1\pdi-ce-6.1.0.1-196\data-integration\lib
 
Now,  restart the kettle if it is already running. 
 
1) File -> New Transformation
2) Right click on "Database Connections" node and then click on "New"
3) As shown in below image give all the properties
Host Name : localhost, database name : xe, username and password : sadakar/sadakar
Click on "Test" button to confirm the connection :
Click on "Share Connection" for future usage.

Aim of the post : 
 lookup the data coming from employee(source) table with department (lookup) table  and insert the location field from department table in empolyee_with_locations (target) table.

Source table : employee
Target table : employee_with_locations
Lookup table : department

 DDL and sample data for employee and department table is as follows 
employee table
CREATE TABLE SADAKAR.employee
(
  EmpID INTEGER primary key
, Name VARCHAR2(30)
, DeptID_Emp INTEGER
)
;

SELECT * FROM employee
 
empid name    deptid_emp
110    Sadakar    10
111    Hasini    10
112    Dolly    20
113    Kutti    20
114    Jikky    30

department table
CREATE TABLE SADAKAR.department
(
  DeptID_Dept INTEGER primary key
, DeptName VARCHAR2(30)
, Location VARCHAR2(2000)
)
;
SELECT * FROM department
deptid_dept deptname location
10    Mathematics    Netherlands
20    Computers    USA

Also create DDL for target table 
employee_with_locations
CREATE TABLE SADAKAR.employee_with_locatioins
(
  empid INTEGER primary key
, name VARCHAR2(30)
, dept_id INTEGER
, location VARCHAR2(2000)
)
;

Now, design the transformation as shown in below image. 
Double click on Stream lookup step and specify the lookup ids and get the retrieve field as shown in below image

Now save the transformation and preview the output. 
Output should be :

Lastly, the difference between "Stream lookup" and "database lookup" is here. 

Stream lookup stores the data in memory and then it will start doing all of the lookups, data can come from anywhere (from file or table)
Database lookup looks up data from a database, and only touches the data you lookup.

References :
http://forums.pentaho.com/showthread.php?65356-Difference-between-stream-value-lookup-and-database-lookup-step

I hope it helps some one.! 

Sadakar Pochampalli

Friday, 29 April 2016

Pentaho Ctools(CDE,CDF,CDA & CGG) technical interview questions

Hi,

I have written basic to intermediate level Ctools interview questions.  

Sample Questions : 
1) How do you write MDX queries in CDE ? How do you feed a chart component with MDX ?
2) What are parameters and listeners ? What is the parameter syntax ? 
3) What are widgets ? give an example
4)  What is cross tab mode & Series in rows for a CCC chart component ?
5)  What are extension points ? Give at least 5 examples.


Download 40+ interview questions here: Click Me

 Cheers..!!!

Thursday, 28 April 2016

Charts CGG Component example in Pentaho CDE

Hi,

This tutorial helps you in understanding Charts CGG Component.

More About CGG : 
http://www.webdetails.pt/ctools/cgg/
http://pedroalves-bi.blogspot.in/2012/09/cgg-putting-ccc-charts-in-pentaho.html
http://diethardsteiner.github.io/prd/2015/02/10/Pentaho-CCC.html

 Webdetails says about CGG
Open up an existing CDE Dashboard in Edit Mode and press the keyboard shortcut "Shift + G". This will prompt a popup, where you can choose which charts in the Dashboard you want to render as CGG charts.
When you save the Dashboard, CGG will generate a JavaScript file for each chart chosen in the popup, and will save it in your Pentaho Solution directory. Those JavaScript files are, basically, CCC chart definitions.

Example : Explanation  with  2 dashboards
1 is for regular dashboard and another is for CGG images dashboard.
Software Environment :
1) Pentaho BA 6.1 CE Server
2) Ctools

Dashboard-1 : 

Lets assume you have below shown dashboard
Open the dashboard in Edit mode and press Shift+G, it will open a pop window.

Observe the generated JS files in the location where the dashboard is saved, for example.

Dashboard-2 :

Design the layout and take two CGG components from CCC Charts as shown below  and give
Cgg path for the Js files generated in dashboard-1

Cgg path for Pie chart in Dashboard-1 : public/test/1_chartPie.js
Cgg path for Dot chart in Dashboard-2 : public/test/2_chartDot.js

NOTE : Cgg Path = Path of generated JS files 

(it can be done in single dashboard also)

(Click the image)

2nd Dashboard Preview : (Click on the image)

NOTE : 
#) In 2nd dash board it is not required define any query components.  
#) 2nd dash board will render the SVG images generated in 1st dashboard and get the image looks like dashboard view. 

Download :
Dashboard-1  & Dashboard-2 :
Click Me 
Deployment:  
Upload the two zip files to Public folder and run PostgreSQL foodmart database in your environment (or change the connections and queries as per your environment).

References : 
http://forums.pentaho.com/showthread.php?146887-Define-Size-of-dot

Learn how to create and use Templates in Pentaho CDE

Hi,
This tutorial teach you how to create & use templates in Pentaho CDE.

Why templates ? 
Templates are pre-defined structure of basic reports/a dashboard.
Whenever you have similar structure for some 4 or 5 dashboards in a project and if you use template you can faster the development time.

Pentaho CDE templates can include Layout, components and Data sources. In simple terms if you save a dashboard as template it will available in "My Templates" section.

Click on this image:


Lets see how to convert a dashboard as a template and use it in a new dashboard creation.

Steps to create a dashboard and convert it as Template
1) File -> New -> CDE dashboard
2) Now, lets layout the dashboard (that we will save as template) as shown in below image
3) Lets define data source connections in "Data source sections" as shown in below image
4) Save the dashboard in some folder in repository and see the preview of the dashboard and the sample is some thing similar to the one shown below.

(Please click on Image for best view)
5) Making dashboard as template 
a) Click on "Save as Template" as shown in below image
b) It will open a popup window. Fill the name, title and check the components and data sources.

c) Now, this saved template "Template_sadakar_sample_2" will be available in "My Templates" section.

6) Applying Template ( Checking whether the template is available or not )
#) click on "Apply" template button.
#) From the opened popup, click on "My Templates" button as shown below

#) Now chose the template created and click on "OK" button.
#) Click on "OK" button..

#) Save the dashboard that is being applied with above template.


This way one can work with templates in CDE editor. I hope it helps some one.!

Sadakar

Passing Blank from Select component - Dispaly All values when you pass Blank(say null) and display specific content when you pass specific value in Pentaho CDE

Hi Folks,

Its always a fun to me to explore a functionality in CDE.!
In this post you will see how to pass Blank ( Assume a NULL) value to  a CCC Bar chart component that should display all bars in graph.

Few questions ? 
1) Did you ever observe Blank/NULL (Say empty value) in a String type select component ?
2) Did you ever pass Blank value to display the whole content ? ( to a chart or to a table component).
   ( NOT "All" value in drop down)

NOTE : Click on images for the content on it

Here is a USE CASE : 
* Display employee "Position Titles" on X axis and "Salaries" on Y-Axis according to "Education Level".
i.e., filter the employee data with "Education Level".
When you pass "BLANK" value you should get the whole content and when you pass "Specific education level" get the data for that specific level.  (Here the employee content is : "Position Titles" on X-axis and "Salaries"  on Y-axis )

Software Environment for this example : 
1) Pentaho BA Server 6.1 CE
2) Pentaho CTools (16.x)
3) Jaspersoft foodmart database - PostgreSQL

1) Dashboard Design 
Design the dashboard as shown in the final output image.  (Not explaining how to work with rows and columns and create html objects - Assuming that you are aware in designing basic layouts). 

2) Components section : 
Creating parameter : 
Parameter : param_education_level
Default value : ' '    (Single quotes & one space in between)

Creating Select Component : 
Name : select_dept_id
Parameter :  param_education_level
Listner : param_education_level
Data source : query_param_dept_id
HTML Object : col_param
Creating bar chart component : 

 3) Data sources section : 
Preparing SQL for parameter : 
SELECT education_level FROM
(
            (SELECT ' ' :: text  AS education_level FROM employee limit 1)
            UNION ALL
            (SELECT DISTINCT education_level::text AS education_level FROM employee )
) a ORDER BY a.education_level


 Preparing SQL for Bar Chart Component
SELECT
               position_title,
               SUM(salary) sal
FROM employee 

WHERE  
         (education_level :: text = ${param_education_level} OR ${param_education_level}=' ')
GROUP BY 

position_title

NOTE : Check CDA preview for the confirmation of data source connection and queries result sets.

Save the dashboard and preview it. 

TEST- 1: Passing Blank Value


TEST-2 : Passing "Partial High School" value from "Education Level" parameter


Few Points & Limitations on this example :
1) ORDER BY for integer inputs may not be sorted (Its depends on how you concatenate ' ' with integer value in SQL).
2) Some times for the first load of the dashboard it is displaying "No Data". (Oops.!).
3) When you map a parameter to a "Select Component" (Single Select) you wont get any special symbol or blank space in the drop down. ( One can find -- dashed lines in Jaspersoft Server for input controls to pass it as NULL value).
4) This example is not intended to replace "All" functionality in the drop down.

Download Example : 
Click Me

Thank you :-) Hope it helps someone.


Wednesday, 27 April 2016

Tip : Activate Pentaho Ctools in Enterprise BA Server 6.x

Hi, 
This post will help you in configuring CDE in EE server.
Environment for this example is :
BA Server EE 6.0.1

1) To make CDE editor available in Pentaho EE server you need to edit code related to it in xml configuration files. files are :  plugin.xml and settings.xml

2) Both files are available at C:\Pentaho\server\biserver-ee\pentaho-solutions\system\pentaho-cdf-dd location.

3) Editing plugin.xml file 
Place-1 : uncomment below code 
             <operation>
                    <id>EDIT</id>
                    <perspective>wcdf.edit</perspective>
                </operation>


Place-2 : uncomment below code 
<overlays>
        <overlay id="launch" resourcebundle="content/pentaho-cdf-dd/lang/messages">
            <button id="launch_new_cde" label="${Launcher.CDE}" command="Home.openFile('${Launcher.CDE}', '${Launcher.CDE_TOOLTIP}', 'api/repos/wcdf/new');$('#btnCreateNew').popover('hide');"/>
        </overlay>
        <overlay id="startup.cde_dashboard"  resourcebundle="content/pentaho-cdf-dd/lang/messages" priority="1">
            <menubar id="newmenu">
                <menuitem id="new-cde_dashboard" label="${Launcher.CDE}" command="mantleXulHandler.openUrl('${Launcher.CDE}','${Launcher.CDE_TOOLTIP}','api/repos/wcdf/new')" />
            </menubar>
        </overlay>
    </overlays>

   
4) Editing settings.xml file 
Define the button for CDE  in Server
Un comment below code that you find at the end

<new-toolbar-button>1,New CDE Dashboard,CDE Dashboard,api/repos/wcdf/new</new-toolbar-button>


Pentaho Offcial Documentation : 
https://help.pentaho.com/Documentation/6.1/0R0/CTools/Activate_CDE

Download the same as PDF file : Click Me.


Tuesday, 26 April 2016

Pentaho EE 6.0.1 complete pack installation images for Windows 64 bit OS

Its been almost 4 years, I had installed Pentaho EE 4.8 server for the first time and later never got a chance to  get EE copy at office or home.. Hmm..!!! CE occupied EE's place in bucket :-)

Installation Environment : 
Windows-7 Professional , 64 bit OS with 8 GB RAM. 


Pentaho EE 6.0.1.386 Server installation images.

Download Location: http://www.pentaho.com/download


1)

2)
3)
4)

5)
6)
7)
8)
9)
10)
11)
12)
13)
14)
15)


Services :


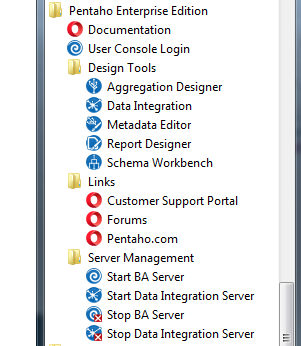
 Menu Bar : 


Installation folder structure : 


Thank you. :-)