Pentaho Tools :

Pentaho C-Tools(CDE,CDF,CDA),Pentaho CE & EE Server,OLAP-Cubes,Analysis using Pivot4J, Saiku Analytics, Saiku Reporting, Ad-hoc Reporting using Interactive Reporting Tool,Dashboards,Reports using PRD, PDD,Data Integration using Kettle ETL,Data Mining usign WEKA,Integration of Servers with Databases,Mobile/iPad compatible Dashboards using Bootstrap Css,Drilldown dashboards,Interactive Dashboards

Friday, 23 August 2013

Reading data from single data source(Single SQL Query) for two charts in pentaho CDE

Hi guys...!!!

Community Dashboard Editor is the best reporting/dash boarding  tool that I have worked. It's smart functionality made me love to work with it and exploring the things time by time.

You'll learn how to fetch different columns from result set of a single query and use them in different analysis purpose in charting.

Recently I needed to work with a single query data source(SQL) of having 3 columns result set ...
Lets say there are 3 columns A,B and C where as A column is having some category names and B and C are having some columns.

A  B   C
--------------
abc 2   4
pqr  6   8 
xyz 10 5
and etc.

From the result set A&B are on first chart and A&C are on other chart..
Now how ?????? This question leads me to check the "Data sources" section of CDE.

Follow the steps below.

1) Click on the "sqloverjndi" which  you created for your SQL query.
2)  In the properties section you can find an option called "Output options". Just click on  it.
3) Let's say you have 3 columns in your result set and these 3 columns takes index values starting from 0 to n.. i.e., A column index is 0 , B column index is 1 and for the C  value 2 is the index.

  NOTE: if you have more numbers of columns you can give as many indexes by clicking "Add" button as many times.
4)For Chart 1:
  i) Click on the chart component where you want show A& B columns ( A is category B is value)
  ii) In the properties(Click on Advanced properties) click on "Pre Execution"
  iii) Write this below code
            function f() {
                                 this.chartDefinition.readers = [
                                 {names:'category', indexes: 0},
                                  {names: 'value', indexes: 1},
                                    {indexs: 2}
                                    ];
             } 

  Why this {indexs:2} ? if you omit this the values of index2 append to the category names... to eliminate that problem you need to write it.

 5) For Chart2 :
 Repeat the steps in in point 4)
 Slight changes in code ...

function f() {
                                 this.chartDefinition.readers = [
                                 {names:'category', indexes: 0},
                                  {names: 'value', indexes: 1},
                                    {indexs: 2}
                                    ];
             } 


You are done with reading data from single query of 3 columns where 1&2 for one chart and 1&3 for another chart...

Save your dashboard and see the preview.

Sadakar
BI developer 
( "Learning never exhausts the mind" )

Thursday, 22 August 2013

CDE TIPS --- Updatable post


1) Dataset
---------------
Solution from this site:
http://forums.pentaho.com/showthread.php?143075-specifying-columns-for-pie-chart-in-CDE&p=351146#post351146

*  Where CDA cached queries are written?
   http://forums.pentaho.com/showthread.php?146940-Where-CDA-cached-queries-are-written

*  specifying columns for pie chart in CDE
   http://forums.pentaho.com/showthread.php?143075-specifying-columns-for-pie-chart-in-CDE

*  CDA documentation Site
   http://www.webdetails.pt/cda/cda-documentation.html


 Class pvc.options.charts.Chart
  
***http://www.webdetails.pt/ctools/charts/jsdoc/symbols/pvc.options.charts.Chart.html#readers

2) Reusable Components & Widgets
--------------------------------------

http://forums.pentaho.com/archive/index.php/t-80505.html
* The "Save as Template" options saves the template under "cde/templates".
* However it saves only the layout, it does not save the components and Data Sources.
* CDE widgets - those were created to encapsulate components and Data Sources in a reusable unit. Maybe they'll be helpful.

* Pentaho BI Dashboard - Widgets Integration
   http://www.youtube.com/watch?v=-IHtefBs_Ps


3) Versioning & Distribution OR Deployment on clinet side
------------------------------------------------------------  
  
  
4) Dashboard refreshing
-------------------------
*     Dashboard - frequently changing data
    Auto refreshing option for the dashboard objects after certain interval
    http://forums.pentaho.com/archive/index.php/t-50277.html

* Refresh Pie Chart in CDE
    http://forums.pentaho.com/showthread.php?81328-Refresh-Pie-Chart-in-CDE
   
* Refresh graph not working
    http://forums.pentaho.com/showthread.php?141105-Refresh-graph-not-working&p=339056&posted=1#post339056
   
* Refresh the entire dashboard
    http://forums.pentaho.com/archive/index.php/t-144858.html

Thursday, 8 August 2013

Disable folders in Browser panel of Pentaho Server


What ever the folder you create in Browser it directly stores under pentaho-soulutions

i.,e in this location

<Pentaho location>Pentaho\biserver-ce-4.8.0-stable\biserver-ce\pentaho-solutions

You can disable all your folders that comes with installation.
Inside every folder you can find "index.xml" file. You need to edit this file. You need to change visable tag as "false".

Find the sanpshot.


You need not restart the server. Just you need to refresh the browser panel in the server.
You can observer the invisibility of the folder.

Sadakar


Setting password to Pentaho Server

Why you need to set the password ?
B'z to publish the reports, schema(s) developed in work bench(PSW).
After publishing your cube you can analyze the date in the server via Analyzer of Pentaho (or) Saiku analytics.

Go to this location 
<location of Pentaho>biserver-ce-4.8.0-stable\biserver-ce\pentaho-solutions\system\publisher-config.xml

Edit this file...
Give your publish password b/w  these tags  <publisher-password> </publisher-password>

Example: 


 <publisher-password>password</publisher-password>

 Snapshot is a worth more than text. find the image below.


Save the file. stop the server and start the server.


References
1)
 http://wiki.pentaho.com/display/ServerDoc1x/Publishing+an+Analysis+Schema+Using+Schema+Workbench

2)
http://wiki.pentaho.com/pages/viewpage.action?pageId=9802803
Thanks
Sadakar

Thursday, 1 August 2013

Date Input Controls/Componets in pentaho CDE with a working example

Hello guys...!!!

In this post you will learn about how to create input controls in CDE.
The dashboard images which I am going to show below are having lots of .css code. I'm not covering all the things but concentrating on only Date input controls in CDE.

My Environment :
BI Server: Pentaho 4.5
CTools:Not found the version numbers of  C-Tools(Unable to check them)-- perhaps..! lesser than 13
Database : hsqldb (Comes along with pentaho installation -- A java based small db for servers like pentaho)

NOTE: Images are taken in this post after worked out the example. So find the yellow rectangular boxes to understand.

You need to work out @ 3 places in "Components" section.
1. Generic
2.Selects
3.Charts
Explained from step 1 to step 3

You need to work out  @ 1 places in "Data Sources" section. i.e, all in "Properties"

I'm not concentrating on Layout part for this example. So wherever the HtmlObject you find in this example replace them with your working HtmlObjects.


Step 1: Creating parameters
* Design your dashboard as per your requirement ( In the images you can find the sample designs).
 In the "Components" section:
1. Click on components
2. Click on Generic
3.Click on Date parameter
4. Go to properties give the name
     eg: param_start_date
5. Click + symbol  per another date parameter
6. Go to properties give the name
    eg: param_end_date

Find the  image


Step 2: Creating Date input Components
            In the "Components" section
1. Click on Componets
2. Click on Selects
3. Click on "Date input Component"
4. Go to Properties give name. eg: start_date in  my example
5. In the properties give HtmlObject. eg: start_date_select
     * HtmlObject is the name of the column where you are putting 
         your dateinput control.
6. Give  Parameter.[It will appear once you try to type]
      eg: In step 1 , created parameters.  so here give "param_start_date"
7. Give Listners[click on it, you will find the list of Listeners. Click OK]
8. Repeat 3-7 for "end_date" Date input
     component


Step 3:
Find the steps in image.


Html Object is the place where you are putting your chart.

Step 4: Applying parameters for Chart & Query
            In the "DataSoruces"
Find the steps in the image
Find the sub sequent image for  Parameters applying for chart & Query.


do same as shown in images.

Step 5:
Save the dashboard and then Click on "Preview" button.
See the images below for sample out put with date input controls.
Preview of the dashboard with out any input controls selection


Preview of the dashboard after selecting date input controls.. find the images below one by one.


Find the image for observing whether the chart become dynamic or not with different date input controls.


That's it.. You are done with date input controls on dashboard.

Thank you for reading this small post.

Sadakar.P
sadakar.1988@gmail.com


Wednesday, 24 July 2013

Pentaho Community Dashboard(CDE) basics - part2.. Extending the dashboard working with parameters

Hi.
This post is the extension of the below post

http://pentaho-bi-suite.blogspot.in/2013/07/pentaho-community-dashboardcde-basics.html

To start with this & if you are begineer in CDE you must go through the above link.

Agenda :
How to create a single select parameter ?
How to make the dashboard better look & Feel ?

Step 1: Layout section

* As shown in figure create a new column in first row
* Properties :
    Name: year_select
    Font : 17


Step 2: In DataSources Section

Name : get_all_years
Jndi: SampleData
Query :
SELECT DISTINCT YEAR_ID as YEAR FROM ORDERFACT ORDER BY YEAR_ID

Step3 : In Components Section
Name : year_picker
Parameter: year
Datasource : get_all_year
HtmlObject :  year_select


Tuesday, 23 July 2013

pentaho data integration (PDI) basics

Pentaho Online Tutorial

http://infocenter.pentaho.com/help/index.jsp?topic=%2Fpdi_user_guide%2Fconcept_pdi_usr_kettle_components.html


Transformations :
 * A Transformation is made of Steps linked by Hops. 
 * These Steps and Hops form paths through which data flows. 
 * Therefore it's said that a Transformation is data-flow oriented.

Jobs are used to coordinate ETL activities such as:
• Defining the flow and dependencies for what order transformations should be run
• Preparing for execution by checking conditions such as, "Is my source file available?," or "Does a table exist?"
• Performing bulk load database operations
• File Management such as posting or retrieving files using FTP, copying files and deleting files
 Sending success or failure notifications through email


Pentaho Data Integration Components

Pentaho Data Integration is composed of the following primary components:
  • Spoon. Introduced earlier, Spoon is a desktop application that uses a graphical interface and editor for transformations and jobs. Spoon provides a way for you to create complex ETL jobs without having to read or write code. When you think of Pentaho Data Integration as a product, Spoon is what comes to mind because, as a database developer, this is the application on which you will spend most of your time. Any time you author, edit, run or debug a transformation or job, you will be using Spoon.
  • Pan. A standalone command line process that can be used to execute transformations and jobs you created in Spoon. The data transformation engine Pan reads data from and writes data to various data sources. Pan also allows you to manipulate data.
  • Kitchen. A standalone command line process that can be used to execute jobs. The program that executes the jobs designed in the Spoon graphical interface, either in XML or in a database repository. Jobs are usually scheduled to run in batch mode at regular intervals.
  • Carte. Carte is a lightweight Web container that allows you to set up a dedicated, remote ETL server. This provides similar remote execution capabilities as the Data Integration Server, but does not provide scheduling, security integration, and a content management system.

What's with all the Culinary Terms?

If you are new to Pentaho, you may sometimes see or hear Pentaho Data Integration referred to as, "Kettle." To avoid confusion, all you must know is that Pentaho Data Integration began as an open source project called. "Kettle." The term, K.E.T.T.L.E is a recursive that stands for KettleExtraction Transformation Transport Load Environment. When Pentaho acquired Kettle, the name was changed to Pentaho Data Integration. Other PDI components such as Spoon, Pan, and Kitchen, have names that were originally meant to support a "restaurant" metaphor of ETL offerings.

Friday, 19 July 2013

Pentaho Community Dashboard(CDE) basics - Creating a Simple Dashboard


Pentaho Community Dashboard Editor (CDE)
What is CDE ?
Where you can get the plug-in in Pentaho Community Server ?
How to download the plug-in & what are the dependencies?
Where you can find the sample examples after installing?
Designing a simple Dashboard

CTools Website – Community Tools
http://www.webdetails.pt/ctools.html

What is CDE ?
CDE is one of the plugins to the Pentaho BI Server, contributed and maintained by Pentaho Partner webdetails.
We create dashboards using this tool.
Community Dashboard Editor (CDE) was born to simplify the creation, edition and rendering processes of the CTools Dashboards.
CDE is a very powerful and complete tool, combining front end with data sources and custom components in a seamless way.

Where you can get the plug-in in Pentaho Community Server ?
How to download the plug-in & what are the dependencies?
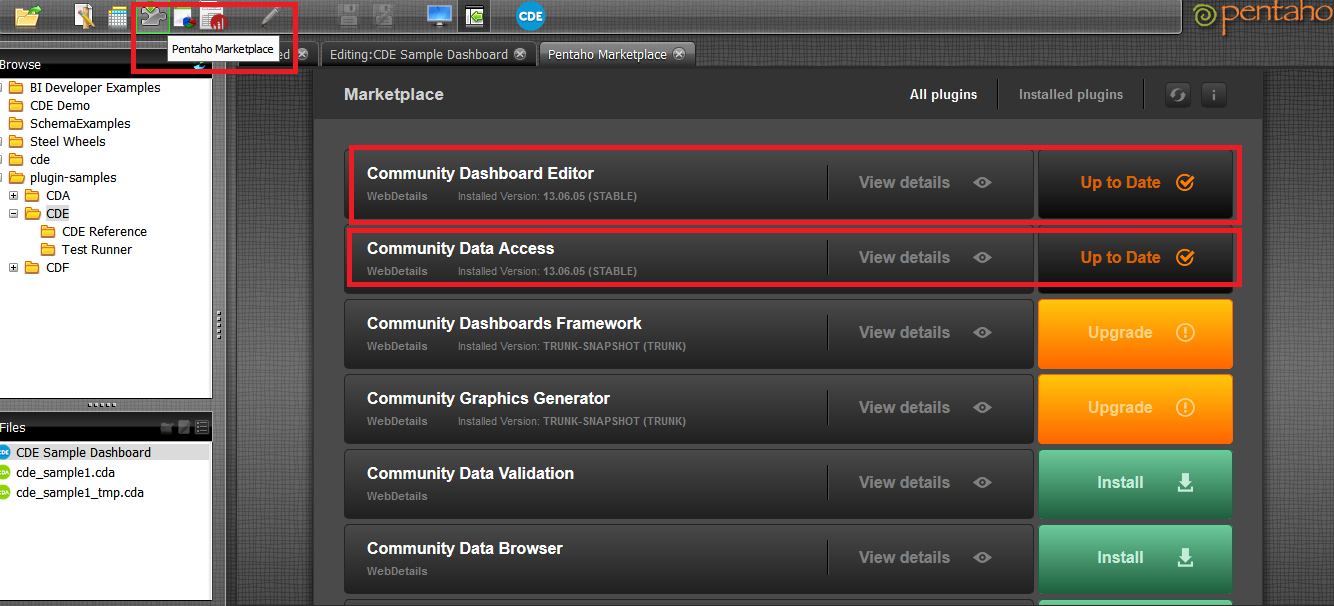
You can find the symbol “Pentaho Market place” on the menu bar..
Click on it you can see the Pentaho Marketplace editor as shown in below figure.
Find Community Dashboard Editor and Click on install.
As I have already installed it is showing up Up to Date.
These all plug-ins are updatable so every time it’s better you need to upgrade.
NOTE:
You must install the dependencies plug-ins before you start working with CDE.

The dependencies for CDE are:
CDF(Community Dashboard Framework)
CDA(Community Data Access)
You must restart your server to take the effect of installation.

Where you can find the sample examples after installing?
* In the left side panel you can find plugin-samples folder.
* Expand it and then click on CDE
* In the Files you can find sample example CDE Sample Dashboard.
* Right Click on CDE_Sample Dashboard àThen click on Edit.
CDE has 3 major components
They are.
* Layout
* Componets
* Data Sources.

CDE has developed based on MVC-2 architecture of Advanced Java Technologies.
* Layout - View
* Components – Controller
* Data sources – Model.
Find the images below to understanding the basic of CDE.

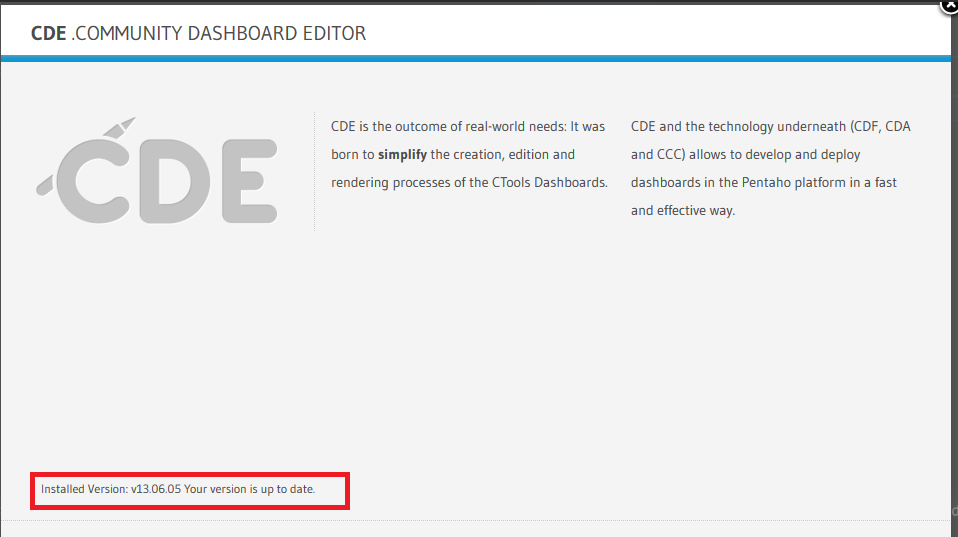
* Scroll down the dashboard. Find “About” on the left side and find the version number of CDE installed.


* Close the version window and Just click on Preview. I’ll let you know how to work out with all the components in CDE with a good working example.
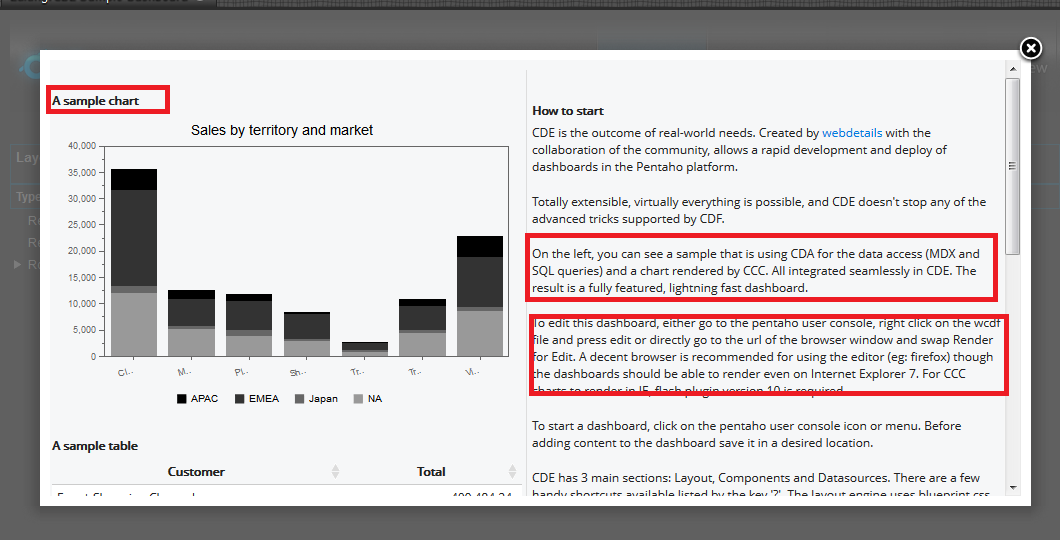
* Now, just click on Preview. You can find the output of the dashboard as shown in below figures.


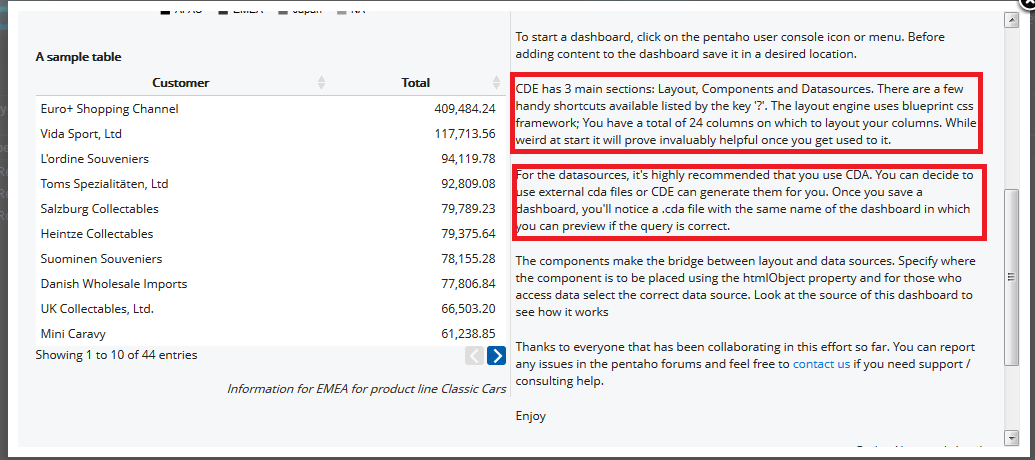
* Scroll down.
* Read the points that were in boxes. You will get the basic idea of CDE dash boarding.

Example:

Aim : To design a simple chart(on dashboard)

Environment:
* Pentaho BI Server community 4.8 stable version.
* CDA,CDF & CDE installed in the server from Market place.
Database: SampleData (It comes along with pentaho installation.. for this artical I'm not connecting to any external database. In the upcoming artical you can find working with databases)

* This example was based upon CCC-Version1. The current Example which I’m going to explain     is based upon CCC2-Version2.
* There is a lots of changes made from CCC-V1 to CCC-V2.
* Make sure your environment of CDE supports CCC-V2 for the example.

Step 1: Creating New CDE Dashboard
There are two ways to create a new CDE dashboard.
         i) From the menu bar
        ii) By clicking CDE icon as shown in figure

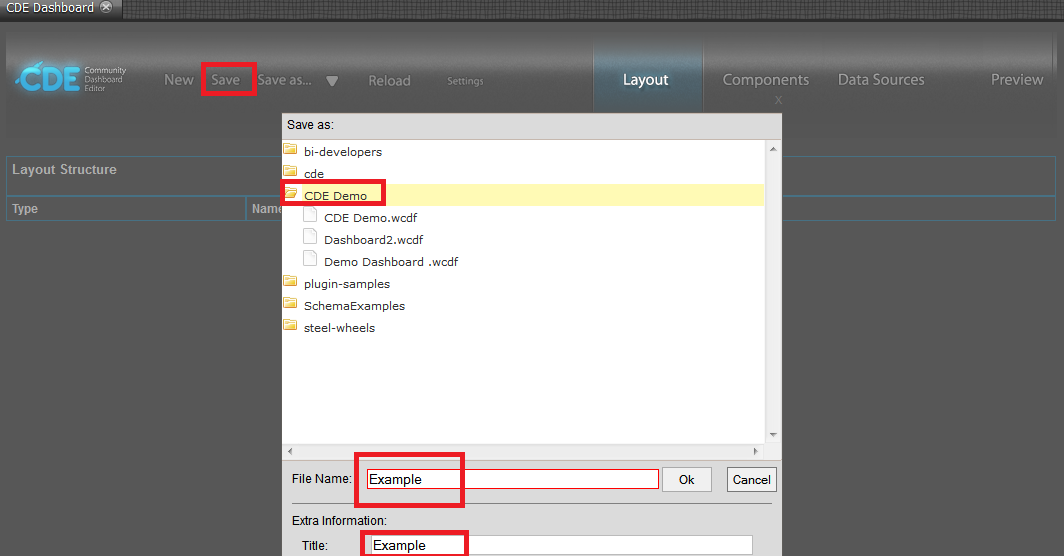
Save your dashboard
Click on Save -> Save your dashboard in your fav folder with your fav name.


 After saving your dashboard  “Refresh your Repository” and then you can find the file as shown below figure.
Step 2:  Working with Layout, Componets and Data sources.
CDE is mainly works on scripting such as css, javascript.
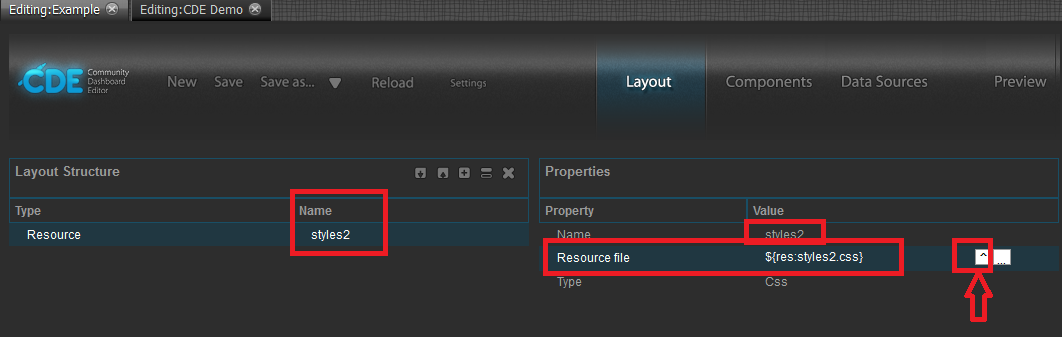
Click on + sign as shown in below figure. (We are going to add Cascading Style Sheet code(css) code to our dashboard).


Resource type : css
External file
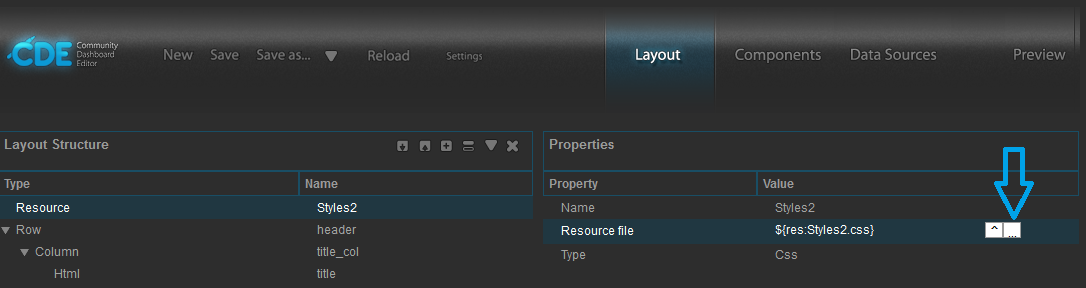
 Resource file : click on   ^  that is highlighted using arrow in the below image.
  
·         * Give Styles2(do not give Styles2.css i.e, only give name but not extension).
·         * It automatically cmes with .css extension and with $ and flower braces.
·         * Save the css file externally to a folder as shown in below figure.
·         * To see the Styles2.css appearing in the folder your file must contain some css code.
·         * You must refresh your Repository to see the name of the file(Styles2.css) in the folder.


Giving Title to Dashboard:
·         CDE layout mainly works on Rows and Columns.
·         Click on Add row symbol as shown in below figure.
 ·         Give name of the Row and give back ground colour as shown in below figure.
·         And give Corners: Round( it is below the back ground , not shown in the image-it is not visible here in the image)
 ·         Now add Column(find ||) symbol on Layout Structure and click on it.
·         Give all the necessary properties as shown in the below figure.
·         Name: title
·         HTML : <h1> Sales OverView YDT <h1> ( as show in figure at arrow symbol click on button.. You will be prompted to a new window there you have to write this HTML Code)
·         Font Size: 10

v See the preview:
The preview consists of only the title of the dashboard with its layout.
It is further going to be modified.

·*          Add your .css code here...


Css code
Body{
                background-color:#fffdf1;
}
h1{
                font-size:24px;
                color:#fff;
                margin-left:10px;
                margin-top:10px;

}


Now see the preview.

 By the time you get some idea on it.
Do as follows, I’m reducing the images now as you might get some idea..
Add another row -> Column->Html  as shown in figure.
For html give Name as title and write HTML code <h3>Sales Performance</h3>  in HTML editor
Add the following code to Styles.css to editor
h3{
    font-size:18px;
                font-weight:bold;
                color:#b68c58;
                margin-left:10px;
                margin-top:10px;
                margin-bottom:8px;
}
.salesTitle{
    color:#666;
                height:2px;
    margin-top:10px;
                margin-left:10px;
                margin-bottom:2px;
                width:939px;
}

Find the images for doing the above and see the preview again

 Add another column as shown in below figure
 Give the following properties:
Name: sales_chart
Span size: 16
Now working with Data Sources and Query part:
 ·         Click on Data Sources
·         Find SQL Queries in Left panel.
·         Click on sql over sqlJndi
·         In left panel give Properties
o   Name : get_sales_performance
o   Access Level : public (default)
o   Jndi: SampleData(We are working with pre defined database that comes along with pentaho software to develop this dashboard)
o   Query:
(
    SELECT
        'Profit' as CATEGORY,
        'Measure' as SERIES,
        SUM(ORDERFACT.TOTALPRICE-ORDERFACT.QUANTITYORDERED*PRODUCTS.BUYPRICE) AS MEASURE   
    FROM
        ORDERFACT
    INNER JOIN PRODUCTS ON PRODUCTS.PRODUCTCODE = ORDERFACT.PRODUCTCODE
    WHERE
        YEAR_ID = 2004
)
UNION ALL
(
    SELECT
        'Profit' as CATEGORY,
        'Target' as SERIES,
        SUM(ORDERFACT.TOTALPRICE-ORDERFACT.QUANTITYORDERED*PRODUCTS.BUYPRICE) AS MEASURE   
    FROM
        ORDERFACT
    INNER JOIN PRODUCTS ON PRODUCTS.PRODUCTCODE = ORDERFACT.PRODUCTCODE
    WHERE
        YEAR_ID = 2003
)
UNION ALL
(
    SELECT
        'Cost' as CATEGORY,
        'Measure' as SERIES,
        SUM(ORDERFACT.QUANTITYORDERED*PRODUCTS.BUYPRICE) AS MEASURE   
    FROM
        ORDERFACT
    INNER JOIN PRODUCTS ON PRODUCTS.PRODUCTCODE = ORDERFACT.PRODUCTCODE
    WHERE
        YEAR_ID = 2004
)
UNION ALL
(
    SELECT
        'Cost' as CATEGORY,
        'Target' as SERIES,
        SUM(ORDERFACT.QUANTITYORDERED*PRODUCTS.BUYPRICE) AS MEASURE   
    FROM
        ORDERFACT
    INNER JOIN PRODUCTS ON PRODUCTS.PRODUCTCODE = ORDERFACT.PRODUCTCODE
    WHERE
        YEAR_ID = 2003
)
UNION ALL
(
    SELECT
        'Revenue' as CATEGORY,
        'Measure' as SERIES,
        SUM(ORDERFACT.TOTALPRICE) AS MEASURE   
    FROM
        ORDERFACT
    WHERE
        YEAR_ID = 2004
)
UNION ALL
(
    SELECT
        'Revenue' as CATEGORY,
        'Target' as SERIES,
        SUM(ORDERFACT.TOTALPRICE) AS MEASURE   
    FROM
        ORDERFACT
    WHERE
        YEAR_ID = 2003
)


Working with Component
·         Click on Components
·         On the left panel click on Charts
·         In properties give the following
o   Name: sales_chart
o   Datasource: get_sales_performance
o   Width: 610
o   Height:140
o   HtmlObject : sales_chart
o   SeriesInRows : False
·         I will show you how to work with Advanced Properties in the upcoming posts on CDE.


Now save your dashboard and Preview
The preview will look like as follows

That’s it we are done with the Dashboard.

Thank you for reading this post :)